OTBI Reporting in Oracle Fusion: A Practical Guide for Finance Teams
Oracle Transactional Business Intelligence (OTBI) is Oracle Fusion's built-in self-service reporting tool that gives finance teams direct access to live transactional data without needing a data warehouse or IT involvement.
- 1.OTBI Reporting in Oracle Fusion: What Finance Teams Need to Know
- 2.What Is OTBI and How Does It Fit Within Oracle Fusion Reporting?
- 3.Navigating OTBI Subject Areas: What Data Can You Access?
- 4.Building Reports in OTBI: Analyses, Dashboards, and Filters
- 5.OTBI Security: Controlling Data Access and Report Permissions
- 6.OTBI Best Practices: Performance, Governance, and Report Management
- 7.Need Help Setting Up or Improving OTBI Reporting in Oracle Fusion?
Oracle Transactional Business Intelligence (OTBI) is Oracle Fusion's built-in self-service reporting tool that gives finance teams direct access to live transactional data without needing a data warehouse or IT involvement.
- ✓OTBI connects directly to Oracle Fusion's live data — no ETL or data warehouse required
- ✓Finance users can build and modify reports using a drag-and-drop interface
- ✓Reports reflect real-time transactional data, making them useful for period-end and ad-hoc analysis
- ✓OTBI is role-secured, so users only see data they are authorised to access
- ✓Understanding subject areas is essential to building accurate, meaningful reports
OTBI Reporting in Oracle Fusion: What Finance Teams Need to Know
Oracle Transactional Business Intelligence (OTBI) is the self-service reporting layer built directly into Oracle Fusion Financials. It queries live data in real time — no data warehouse, no overnight refresh, no waiting on IT to pull a report for you.
That last point matters more than it might seem.
Finance teams lose significant time chasing extracts that are already a day old by the time they land. OTBI cuts that out entirely. You're working against current transactional data — payables, receivables, general ledger, expenses — through a drag-and-drop interface that requires no SQL and no developer involvement.
The building blocks are called subject areas.
These are pre-built data models that map to specific functional areas inside Oracle Fusion. A common mistake we see during reporting reviews: teams pick the wrong subject area and wonder why results come back incomplete or misleading. It's worth taking time here before you build anything.
Access runs through Oracle's security model, so report outputs automatically reflect each user's permissions. No manual filtering to hide sensitive data. It's enforced at the source.
So where does OTBI fall short? Complex cross-functional reporting and long-range historical trend analysis can push against its limits. But for day-to-day operational reporting and ad-hoc analysis within Oracle Fusion, it covers far more ground than most finance teams expect when they first encounter it.
What Is OTBI and How Does It Fit Within Oracle Fusion Reporting?

Oracle Transactional Business Intelligence (OTBI) is Oracle Fusion's built-in self-service reporting tool. It sits directly on top of Fusion's transactional data — meaning finance and operations teams can build and run reports without leaving the application or raising an IT request.
- OTBI (Oracle Transactional Business Intelligence)
- OTBI is a self-service reporting tool embedded within Oracle Fusion, built on OBIEE technology, that allows users to query live transactional data through pre-built subject areas without writing SQL.
Architecture: Built on OBIEE
Under the hood, OTBI runs on Oracle Business Intelligence Enterprise Edition (OBIEE) technology, embedded directly into Oracle Fusion Cloud. Users get a familiar analysis and dashboard interface. The system handles the connection to Fusion's transactional tables automatically.
What makes OTBI distinct is how it accesses data.
Rather than pulling from a separate data warehouse, it queries Oracle Fusion's subject areas — pre-built, role-secured semantic layers mapped to specific functional areas like Payables, Receivables, General Ledger, Projects, and Procurement. Users work with terms like "Invoice Amount" or "Supplier Name" instead of database table references. No translation required.
No scheduled batch. No extract process sitting between the user and the data. Reports reflect the current state of transactions in Oracle Fusion.
Subject Areas Drive Report Scope
Each OTBI subject area corresponds to a specific Oracle Fusion module. Choosing the right subject area is the first and most important decision when building any OTBI report, as it determines which data columns are available.
How OTBI Compares to Other Oracle Fusion Reporting Tools
Oracle Fusion ships with several reporting tools. Picking the wrong one for a given requirement is a common mistake we see during audits and implementations — each tool exists for a reason, and the differences matter.
| Tool | Primary Use Case | Data Access Method | Best For |
|---|---|---|---|
| OTBI | Ad hoc and operational analysis | Live Fusion subject areas via OBIEE | Finance and operations users building flexible queries |
| Financial Reporting Studio | Formatted financial statements | Essbase / GL balances cube | Period-end balance sheet, P&L, and statutory reports |
| Smart View | Excel-based financial analysis | Essbase / GL balances cube | Finance teams working in Excel with drill-down capability |
| BIP (BI Publisher) | Pixel-perfect operational documents | SQL queries and data models | Invoices, remittances, and structured transactional outputs |
Financial Reporting Studio is built for outputs that need to match a precise layout — regulated financial statements, board packs, reports where row and column positioning is fixed. It draws from the General Ledger balances cube rather than transactional tables. That suits period-end reporting well, but makes it the wrong choice for mid-period or cross-functional queries.
Smart View connects Excel directly to that same Essbase cube. Finance teams who need GL balances in spreadsheets — to model or manipulate data outside the browser — tend to live there.
BIP handles structured document output. Formatted invoices, payment remittances, regulatory filings. Use it when template design and print layout matter as much as the underlying data.
OTBI sits in a different space entirely. It's the right tool when someone needs to interrogate transactional records, combine data across functional subject areas, or answer a business question quickly without a pre-designed template. That flexibility is exactly why it gets used so often — and why understanding it properly matters.
Compare the other reporting tools
Navigating OTBI Subject Areas: What Data Can You Access?
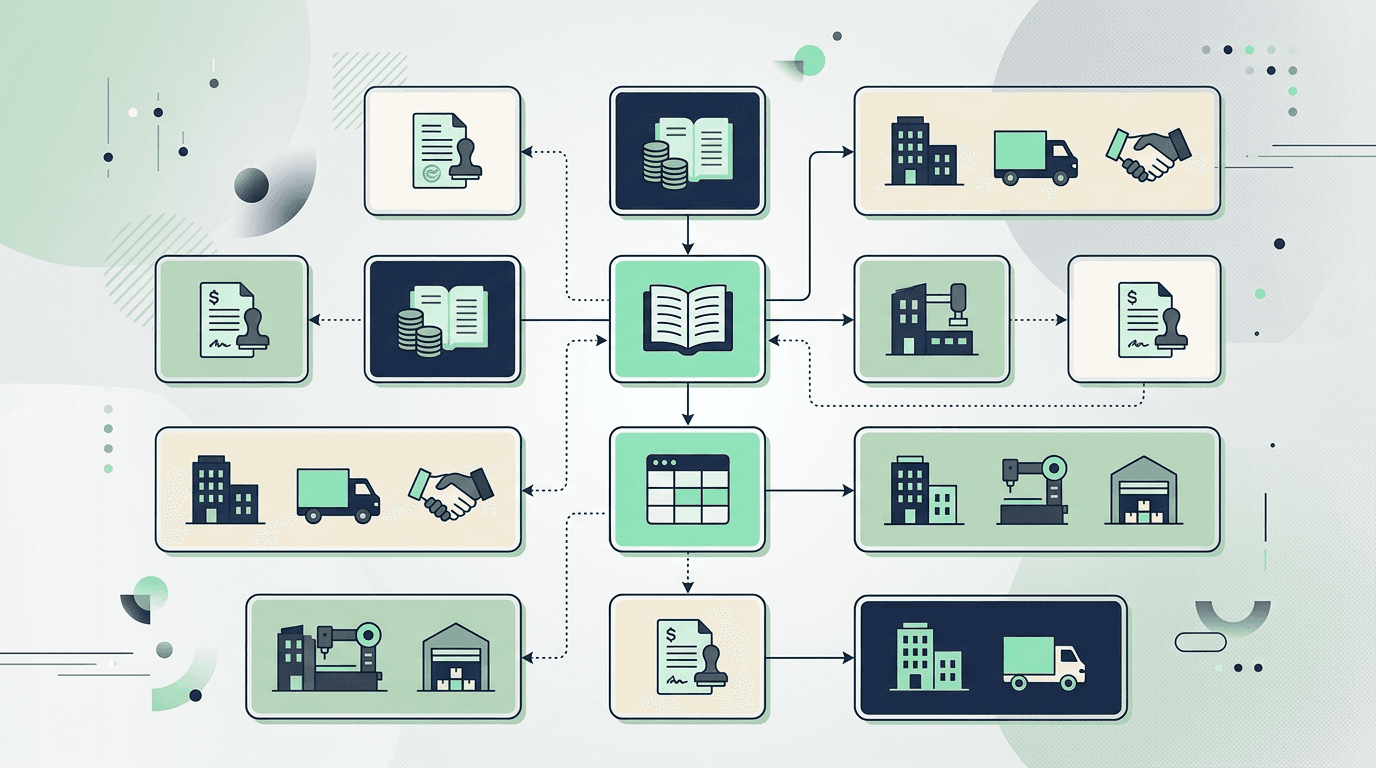
Subject areas are the foundation of OTBI reporting. Every subject area is a pre-built logical data model tied to a specific functional module — Financials, Procurement, Projects, HCM, and so on. Oracle doesn't expose raw database tables. Instead, it presents data through structured models, organising columns into recognisable business terms rather than technical schema names.
When you open OTBI and pick a subject area, you're choosing the domain you want to report on.
That decision matters more than most people realise when they're starting out.
Oracle Fusion ships with hundreds of subject areas out of the box. Finance teams tend to work most frequently with these:
- ✓General Ledger — account balances, journal entries, budget versus actual comparisons
- ✓Payables — invoice status, supplier balances, payment runs, aging schedules
- ✓Receivables — customer invoices, receipts, open balances, aging buckets
- ✓Fixed Assets — asset registers, depreciation schedules, additions and retirements
- ✓Expenses — employee expense reports, approval status, spend by cost centre
Each subject area is self-contained. You can't mix columns from Payables and General Ledger in a single standard report — not without a custom approach. So choosing the right subject area before you start building is one of the most consequential decisions in the whole process.
Choose Your Subject Area First
Selecting the wrong subject area is one of the most common mistakes in OTBI reporting. Each subject area is scoped to a specific functional domain, and columns cannot be mixed across areas in a standard report.
Facts and Dimensions
Every subject area splits its columns into two types: facts and dimensions.
Facts are the numbers. Invoice amounts, ledger balances, depreciation charges, expense totals. These are what you sum, average, or compare.
Dimensions are the descriptive attributes that give those numbers context — accounting period, supplier name, cost centre, ledger name, asset category, employee. Dimensions are how you slice and filter.
The underlying model handles all the join logic automatically. You pick your facts and dimensions, and the data comes back correctly without you manually defining any table relationships. For finance users without a SQL background, that's genuinely one of OTBI's strongest practical advantages.
Example: GL Account Balance Report
A finance analyst opens the 'General Ledger - Balances Real Time' subject area, selects the Accounting Period and Account dimensions alongside the Period Activity and Closing Balance facts. The result is a trial balance by period, filtered to a specific ledger and cost centre.
Common Report Builds in Finance Subject Areas
Invoice aging is one of the most common Payables reports we see teams build. Supplier name, invoice date, due date, outstanding amount — filter for open invoices. Clean aging report, showing what's owed, to whom, and how overdue. See our Oracle Fusion Accounts Payable guide for the process behind those numbers.
Receivables follows the same logic from the other side. Open invoice balances grouped by customer and aging bucket, giving collections a clear picture of what's outstanding. The underlying process is covered in our Accounts Receivable guide.
For Fixed Assets, the standard build pulls asset category, acquisition date, net book value, and accumulated depreciation. Working asset register, without much complexity.
200+
Oracle Fusion ships with over 200 pre-built OTBI subject areas covering Finance, HCM, Procurement, Projects, and Supply Chain modules.
Source: Oracle Fusion Analytics documentation
Procurement subject areas follow the same fact-dimension structure, covering purchasing documents, supplier performance, and spend analysis. For a detailed breakdown of what's available there, see our Oracle Fusion Procurement coverage, and the wider Oracle Fusion Cloud ERP modules overview.
Knowing which subject area maps to which process — and how facts and dimensions work within it — is what separates reports that actually answer business questions from reports that just pull data.
Building Reports in OTBI: Analyses, Dashboards, and Filters
OTBI reporting in Oracle Fusion follows a clear sequence: pick a subject area, define your criteria, apply filters, choose how to display the data, and publish to a dashboard. Simple enough in theory.
In practice, the steps where teams most often go wrong are filter logic and prompt mapping. And those mistakes don't always surface until a report lands in front of a finance director showing the wrong totals.
Analyses: The Foundation of Every Report
An analysis is the core report object in OTBI. When you create one, you're working across four tabs:
- ✓Criteria – select columns from a subject area, set column formulas, apply custom aggregations
- ✓Results – choose how the data displays: table, pivot table, bar chart, line chart, and others
- ✓Filters – restrict the data set by business unit, date range, account status, or whatever the report requires
- ✓Prompts – expose filter controls to end users so they can adjust parameters without touching the underlying analysis
Sort order is set on the Criteria tab. Aggregations — sum, count, average, max — go through the column formula editor or the totals settings in Results.
Walkthrough: Outstanding AR by Customer
This is one of the most common finance reports we see built in OTBI. Here's how to build it from scratch.
Building an Outstanding AR by Customer Report in OTBI
Select the Subject Area
Navigate to New Analysis and choose the 'Receivables - Standard Receivables Transactions Real Time' subject area. This contains invoice, customer, and balance data.
Add Columns to Criteria
Drag in Customer Name, Invoice Number, Invoice Date, Due Date, Invoice Amount, and Amount Due Remaining. Set Amount Due Remaining to use a Sum aggregation at the customer level.
Apply Filters
Add a filter on Status equal to 'Open' to exclude settled invoices. Add a Business Unit filter and set it as a prompt so users can select their own unit at runtime.
Choose a Visualisation
On the Results tab, start with a table view for the detailed invoice list. Add a pivot table view grouped by Customer Name to show total outstanding balance per customer.
Save and Publish
Save the analysis to a shared folder your finance team can access. Open your target dashboard, click Edit, and add the analysis as a dashboard section. Set the page prompt to pass the Business Unit filter through.
Dashboard Design and Prompt Linking
Dashboards pull together multiple analyses into a single view. The tricky part is understanding how dashboard prompts differ from analysis-level filters.
Dashboard prompts sit at the page level and pass values into every analysis on that page. But only if the column mappings match exactly.
A common mistake we see is a dashboard prompt built on a slightly different column reference than the one used inside the analysis. The filter silently fails to apply. No error message. No warning. Just wrong data.
Always verify the column reference in the prompt matches the column reference in each linked analysis before you publish.
Report Build Timeline: From Requirement to Publication
OTBI Report Build: From Brief to Live Dashboard
Day 1
Confirm Requirements
Agree on the data fields, filters, and intended audience with the report owner. Identify the correct subject area before building starts.
Day 2
Build and Test the Analysis
Create the analysis in a personal folder. Test filters, validate aggregations against known figures in the source system, and check for null values in key columns.
Day 3
Add Visualisations and Prompts
Set up the required views — table, pivot, or chart. Configure user-facing prompts and confirm they pass values correctly to all filters.
Day 4
Peer Review
Have a second team member validate results independently. Cross-check totals against Oracle Fusion transactional screens or known ledger balances.
Day 5
Publish to Dashboard
Move the analysis to a shared folder, add it to the target dashboard, configure page-level prompts, and assign access permissions by role.
Configuration Checklist for Accurate, Performant Reports
Before a report goes to production, run through this checklist.
Reports that skip these steps tend to return incorrect totals, run slowly, or break entirely for users with different security profiles. We see this in audits more than you'd expect.
OTBI Report Quality and Performance Checklist
- ✓Confirm you are using the correct subject area for the data domain
- ✓Verify all column references resolve without errors in the Criteria tab
- ✓Check that aggregation rules (Sum, Count, Average) are set at the right level
- ✓Apply a date range filter to prevent unbounded queries that return excessive rows
- ✓Test all prompts to confirm they pass values to analysis filters correctly
- ✓Validate report totals against a known source — a transactional screen or ledger report
- ✓Check report output under at least two different user roles to confirm security filtering applies correctly
- ✓Save the analysis to a shared folder with appropriate folder-level permissions
- ✓Link the analysis to the dashboard and confirm dashboard prompts are mapped to the right columns
- ✓Document the subject area, filters, and business rules used so the report can be maintained by others
Getting this right the first time matters. A well-built OTBI analysis is repeatable, maintainable by someone other than the original builder, and accessible to the right users without manual intervention.
Skipping validation — criteria, filters, prompts, dashboard configuration — is exactly how data errors creep in. And once a finance team loses confidence in self-service reporting, rebuilding that trust takes far longer than getting the report right in the first place.
OTBI Security: Controlling Data Access and Report Permissions
Security in OTBI reporting in Oracle Fusion is not a bolt-on configuration. It is inherited directly from Oracle Fusion's core data security model. That means the data a user sees in a report is controlled by exactly the same policies that govern their application access. Most teams don't fully appreciate that distinction until they start rolling OTBI out to a wider user base — and the access issues start surfacing.
How OTBI Inherits Oracle Fusion Data Security
OTBI enforces row-level security through data roles. When a user runs an analysis, the subject area only returns the rows they are permitted to see — based on their assigned data roles and the security policies attached to them.
For finance teams, this typically means restrictions at business unit level.
A payables clerk assigned to Business Unit A will not see transactions from Business Unit B — provided the data roles are configured correctly. That last part matters. Ledger and legal entity restrictions work the same way: a user without access to a specific ledger in Oracle General Ledger won't see that ledger's data in OTBI financial subject areas. The security policies attached to Oracle Fusion job roles and data roles carry through automatically. There is no separate OTBI security layer to configure for this.
In our experience
Organisations that treat OTBI security as an afterthought — configuring it after reports are already built — spend significantly more time unpicking access issues than those who define data roles and security policies before report development begins. Security design should sit upstream of report design, not after it.
Configuring OTBI Duty Roles and Catalogue Permissions
OTBI has its own role hierarchy for controlling who can author, edit, and view reports. Duty roles like BI Author and BI Consumer govern authoring permissions. Catalogue folder security controls which shared folders a user can actually reach. Both are managed through the Oracle Analytics Server (OAS) security model embedded within Fusion.
To configure catalogue folder security: navigate to the catalogue, select the folder, and assign permissions at the role or user level — Read, Write, or Full Control.
Most end users should have Read access only on shared production folders. Write access belongs to report developers and administrators.
That is not a suggestion. It is the configuration that prevents users from overwriting or deleting live reports.
For broader guidance on how roles interact across Oracle Fusion — including segregation of duties considerations — see our article on roles and segregation of duties.
Over-Permissive Catalogue Access
Granting BI Author or Write access to shared catalogue folders to all users is one of the most common OTBI security errors. Users with Write access can overwrite or delete production reports. Restrict Write access to a defined group of report developers and use folder-level permissions to enforce this.
Common Security Mistakes to Avoid
We see two issues come up repeatedly during OTBI implementations.
The first is missing data security policy assignments. If a user receives a job role without the corresponding data role, they will either see no data at all — or, in some configurations, unfiltered data across every business unit. Neither outcome is acceptable in a controlled environment. Both are surprisingly easy to miss during setup.
The second is cross-ledger data exposure. This usually appears when data security policies are not scoped correctly to ledger or legal entity — a user with a broad data role may inadvertently pull journal entries or balances from ledgers outside their remit.
So what does proper validation actually look like? Run test analyses under the user's credentials before go-live, not after. Always.
Misconfigured data roles
Are the leading cause of unintended data exposure in Oracle Fusion reporting environments, according to Oracle implementation partners. Row-level security depends entirely on data role assignments being accurate and complete.
Source: Oracle Fusion Implementation Best Practices, Oracle Partner Network
Initial configuration is only part of the work. As users move between roles or business units, their data role assignments need to follow. Stale role assignments are a persistent risk in live environments — and regular access reviews are how you stay ahead of it.
OTBI Best Practices: Performance, Governance, and Report Management
OTBI gives finance teams real self-service capability inside Oracle Fusion. But without clear standards, report catalogues turn into a mess fast — cluttered folders, duplicate analyses everywhere, performance that quietly degrades until someone complains.
Getting governance right early saves a lot of painful rework.
Naming Conventions and Folder Organisation
Consistent naming is the foundation of a manageable catalogue.
Analyses should follow a structured pattern covering the functional area, report purpose, and owning team — something like FIN_AP_AgingDetail_FinanceOps. Dashboards follow the same logic. Names like "Test Report" or "Copy of Analysis 1" are the primary driver of catalogue sprawl. We see this in almost every post-go-live environment we audit.
Folder structure should mirror your functional hierarchy. Top-level shared folders by department — Finance, Procurement, HR — then subfolders by process area: Payables, Receivables, General Ledger. Restrict write access to those shared folders. Only designated report owners should be able to publish there.
Personal folders are for development and drafts. Nothing unfinished belongs in a shared location.
Catalogue clean-up
A poorly structured report catalogue is often harder to clean up than building a new one from scratch.
Avoiding Report Duplication
Duplication is the most common governance failure we see in OTBI environments.
The pattern is predictable: a user can't find an existing report, so they build another one. Repeat that a few dozen times and the catalogue becomes unusable. So what actually fixes it?
Two things. First, a searchable index — even a shared spreadsheet — logging published analyses by name, subject area, and owner. Second, a quarterly catalogue review to identify and retire what's no longer used.
Before publishing anything new, report owners should check whether an existing analysis can be extended with additional prompts. A single well-designed analysis with dashboard prompts will almost always outperform five near-identical reports sitting in different folders.
Performance Optimisation
Performance problems in OTBI usually come from a small set of avoidable design decisions. Most teams miss this until queries start timing out.
Keep column counts low. Include only what the specific use case actually needs — every additional column adds to query processing time, particularly against large transaction tables where that cost compounds quickly.
Filters aren't optional in high-volume subject areas. Always apply filters on date ranges, business units, or ledgers before running an analysis.
Unfiltered queries against Payables Invoices or General Ledger Balances will be slow. In some environments, they'll time out entirely. This shows up constantly during performance audits, and it's almost always avoidable.
Cross-subject-area joins are a different problem. They generate complex SQL and frequently produce unexpected row counts alongside the performance hit. If a report genuinely needs data from two subject areas, that's a signal to evaluate BI Publisher against the Oracle Fusion data model instead — it's a more appropriate tool for that kind of requirement.
OTBI Governance Checklist for Finance Teams
- ✓Define a naming convention for analyses and dashboards before any reports are published
- ✓Create a shared folder structure aligned to functional areas (Finance, Procurement, etc.)
- ✓Restrict write access to shared folders — use personal folders for drafts
- ✓Maintain a report register logging each published analysis, its subject area, and owner
- ✓Run a quarterly catalogue review to retire unused or duplicate reports
- ✓Apply date, business unit, or ledger filters on all high-volume analyses
- ✓Limit column count to only what the report consumer needs
- ✓Avoid cross-subject-area joins; use BI Publisher for complex multi-source requirements
Establishing a Reporting Standard
The teams that get this right set standards before go-live. Not after the catalogue has already become a problem.
Assign a report catalogue owner. Document the conventions in a one-page standard. Make the naming guide and folder structure available to anyone with OTBI access from day one. It doesn't need to be complicated — it just needs to exist before users start publishing.
Key Takeaways
- ✓Naming conventions and folder structure should be defined before go-live, not after catalogue sprawl has already occurred.
- ✓A shared report register and quarterly review process are the most effective tools for preventing duplication.
- ✓Filters on date ranges and organisational attributes are essential on any high-volume OTBI analysis.
- ✓Limiting column counts directly reduces query load — only include what the end user needs.
- ✓Cross-subject-area joins carry a real performance cost; treat them as a design flag, not a routine approach.
- ✓Assigning a catalogue owner with clear responsibilities is as important as any technical governance rule.
Need Help Setting Up or Improving OTBI Reporting in Oracle Fusion?
Getting OTBI right from the start saves finance and IT teams a serious amount of rework. Correct subject areas, proper security roles, a clean catalogue structure — none of it is complicated to get right initially, but painful to fix later.
We see inherited reporting environments constantly.
Misconfigured setups, bloated catalogues, roles that no longer reflect how the business actually operates. It's fixable. But it's always easier — and cheaper — to avoid in the first place.
Whether you're implementing OTBI for the first time, untangling something someone else built, or looking for ongoing managed support, AppsolveGroup works with Oracle Fusion clients at every stage of that journey.
Our team supports finance directors, FP&A leads, and IT managers who need reporting they can actually rely on — without the overhead of managing it internally.
Setup. User training. Report builds. Catalogue governance. Practical and hands-on, not theoretical.
Oracle Fusion Reporting Support and Implementation
Work with AppsolveGroup to build, improve, or manage your OTBI reporting environment with expert Oracle Fusion guidance.
Explore Managed SupportHave a specific reporting challenge? Or just want to understand what a managed support arrangement actually looks like in practice? Get in touch directly.
Speak With an Oracle Fusion Reporting Specialist
Contact AppsolveGroup to discuss your OTBI requirements, from implementation to training and ongoing reporting support.
Contact UsRelated Oracle Fusion Reporting Guides
You might also find helpful
Oracle Fusion Reporting Tools: An Overview
Compare all Oracle Fusion reporting tools and choose the right one for your requirement.
Smart View for Oracle Fusion
Connect Excel to live Oracle data for ad hoc reporting, planning, and budgeting.
Financial Reporting Studio
Formatted financial statements and period-end reporting from the GL balances cube.
Managed Oracle Fusion Support Services
Ongoing Oracle Fusion support for finance teams who need expert help without growing headcount.
Need Help Setting Up or Improving OTBI Reporting?
Talk to APPSolve Group for clear, practical guidance from an experienced Oracle partner.
Get in touch about OTBI reporting in Oracle Fusion
Kirankumar and Johan and the wider APPSolve Group team can talk through your situation — no obligation, no generic sales pitch. Just a direct conversation about what a realistic path forward looks like.